Cargo Handled at Tsuruga Port

Cargo Handled at Tsuruga Port

Trends in Cargo Volume at Tsuruga Port

Cargo Volume Handled in 2023

Container Cargo Volume Handled in 2023

Breakdown of Handled Cargo Items (2023)

Foreign currency

Domestic Currency

Cargo Volume by Year (Details)

Preliminary Container Handling Volume in 2023

○ NMonthly Container Handling Volume (TEU)

ExportImportOutgoing TransferIncoming TransferTotal
Jan.9308221,2342,4525,438
Feb.9998581,4592,5865,902
March9781,1031,7162,5776,374
April1,1381,0221,6452,3686,173
May8531,0741,1061,7504,783
June1,1961,1331,3322,0555,716
July1,2241,3831,4712,7786,856
Aug.1,2071,3511,5324,9869,076
Sept.1,1321,3801,6724,5408,724
Oct.1,2041,2211,3524,2047,981
Nov.1,5321,4811,2242,5866,823
Dec.1,0991,3581,4772,2116,145
Meters13,49214,18617,22035,09379,991

Maritime Cargo Throughput in 2023 (Preliminary Report)

○ Monthly Maritime Cargo Throughput (Unit: Tons)

ExportImportOutgoing TransferIncoming TransferTotal
Jan.21,188414,754460,958468,9811,365,881
Feb.25,052363,175477,391520,7051,386,323
March18,343230,494553,461626,9841,429,282
April18,095242,492513,342603,6791,377,608
May35,409160,706456,017540,4621,192,594
June21,910247,029521,726599,8421,390,507
July12,172104,652527,029669,2981,313,151
Aug.23,449400,153556,196646,6411,626,439
Sept.11,967217,550606,617651,5931,487,727
Oct.20,776335,446577,901663,5661,597,689
Nov.15,079231,752470,324533,8741,251,029
Dec.25,658311,444485,476596,2551,418,833
Meters249,0983,259,6476,206,4387,121,88016,837,063


Annual Transition Table of Container Cargo

2017-2023

○Total Container Volume Handled (TEU) *Numbers in parentheses indicate loaded containers 

Category/YearExportImportOutgoing TransferIncoming TransferTotal
201719,97519,5909,98628,28177,832
(10,680)(17,671)(5,394)(28,073)(61,818)
201818,27518,31510,20129,98076,771
(10,175)(17,536)(5,769)(29,808)(63,288)
201916,49415,99022,25940,04694,789
(8,030)(15,287)(8,238)(31,441)(62,996)
202013,28513,28726,01052,919105,501
(6,627)(12,932)(8,841)(34,149)(62,549)
202113,99214,01317,15043,80688,961
(6,932)(13,265)(9,454)(33,974)(63,625)
202213,17313,39717,57635,08679,232
(6,459)(12,079)(11,640)(35,048)(65,226)
202313,49214,18617,22035,09379,991
(7,047)(13,219)(11,923)(35,043)(67,232)

(Reference) Container Cargo Volume by Port (FY2023 Preliminary Data – Extract: Sea of Japan Side of Honshu) (TEU)

Port nameTotal container handling volumeForeign Trade ContainersDomestic Trade Containers
Akita Port46,61530,34016,275
Niigata Port218,860154,63064,230
Fushiki Toyama Port75,83468,3077,527
Kanazawa Port67,25167,2510
Tsuruga Port79,99127,67852,313

  (From the 2023 MLIT Report: Container Cargo Volume by Port)


○ Loaded Foreign Trade Containers (Tonnage, TEU)


By division/year
ExportImportTotal
(Tons)(TEU)(Tons)(TEU)(Tons)(TEU)
2017153,59310,680236,00617,671389,59928,351
2018122,17410,175203,19017,536325,36427,711
2019100,9928,030213,17215,287314,16423,317
202074,5296,627168,92312,932243,45219,559
202171,8426,932144,66213,265216,50420,197
202286,8346,459156,20212,079243,03618,538
202383,2527,047169,47313,219252,72520,266

Including on-chassis containers
 

Annual Transition Table of Maritime Cargo Throughput

2017-2023 (Unit: Tons)


By division/year
Foreign TradeInternal TradeTotal
ExportImportMetersOutgoing TransferIncoming TransferMeters
2017389,7863,352,8483,742,6345,799,3506,360,66212,160,01215,902,646
2018296,1583,493,5423,789,7005,875,9096,295,53612,171,44515,961,145
2019218,2503,668,4063,886,6566,216,6417,042,52313,259,16417,145,820
2020190,6913,589,7473,780,4385,962,5856,656,45512,619,04016,399,478
2021267,0384,089,8744,356,9125,762,4646,619,85412,382,31816,739,230
2022296,9893,325,3363,622,3256,056,0637,035,61313,091,67616,714,001
2023249,0983,259,6473,508,7456,206,4387,121,88013,328,31816,837,063


Annual Table of Incoming Vessels by Type

2017-2023

By division/yearCommercial VesselFishing VesselOther
Vessels of the
Evacuation VesselTotal
Ocean-going VesselsCoastal VesselsMeters
2017(Number)(363)(1,025)(1,388)(116)(575)(1)(2,081)
Total tonnage4,577,73910,732,59915,310,33813,503158,53849915,482,878
2018(Number)(355)(1,011)(1,366)(154)(488) (2,008)
Total tonnage4,301,49810,869,77515,171,27320,31296,259 15,287,844
2019(Number)(340)(1,196)(1,536)(99)(361) (1,966)
Total tonnage4,204,00012,251,70216,455,70211,20686,229 16,553,137
2020(Number)(296)(1,258)(1,554)(94)(359) (2,007)
Total tonnage3,600,87313,181,05016,781,92311,156116,991 16,910,070
2021(Number)(290)(1,189)(1,479)(70)(410) (1,959)
Total tonnage3,834,67812,454,92116,289,5998,840142,910 16,441,349
2022(Number)(264)(1,252)(1,516)(63)(414) (1,993)
Total tonnage3,209,04112,707,81515,916,8568,343201,285 16,126,484
2023(Number)(255)(1,149)(1,404)(59)(389) (1,852)
Total tonnage3,340,42412,010,97015,351,3947,954170,254 15,529,602

Annual Transition Table of Ferry Usage

2017-2023


By division/year
Embarked and Disembarked Persons (persons)Embarked and Disembarked Vehicles (units)
Ride-onLandingTotalOutgoing TransferIncoming TransferTotal
201738,42745,12383,55065,22158,062123,283
201834,51640,84575,36167,68558,449126,134
201939,90044,48984,38967,38460,080127,464
202019,60722,39141,99855,71752,573108,290
202120,15422,18942,34354,38351,767106,150
202230,11432,54862,66261,89958,087119,986
202339,77342,96882,74165,33659,694125,030

Related file download

Back to Tsuruga City Top>>

Related Articles

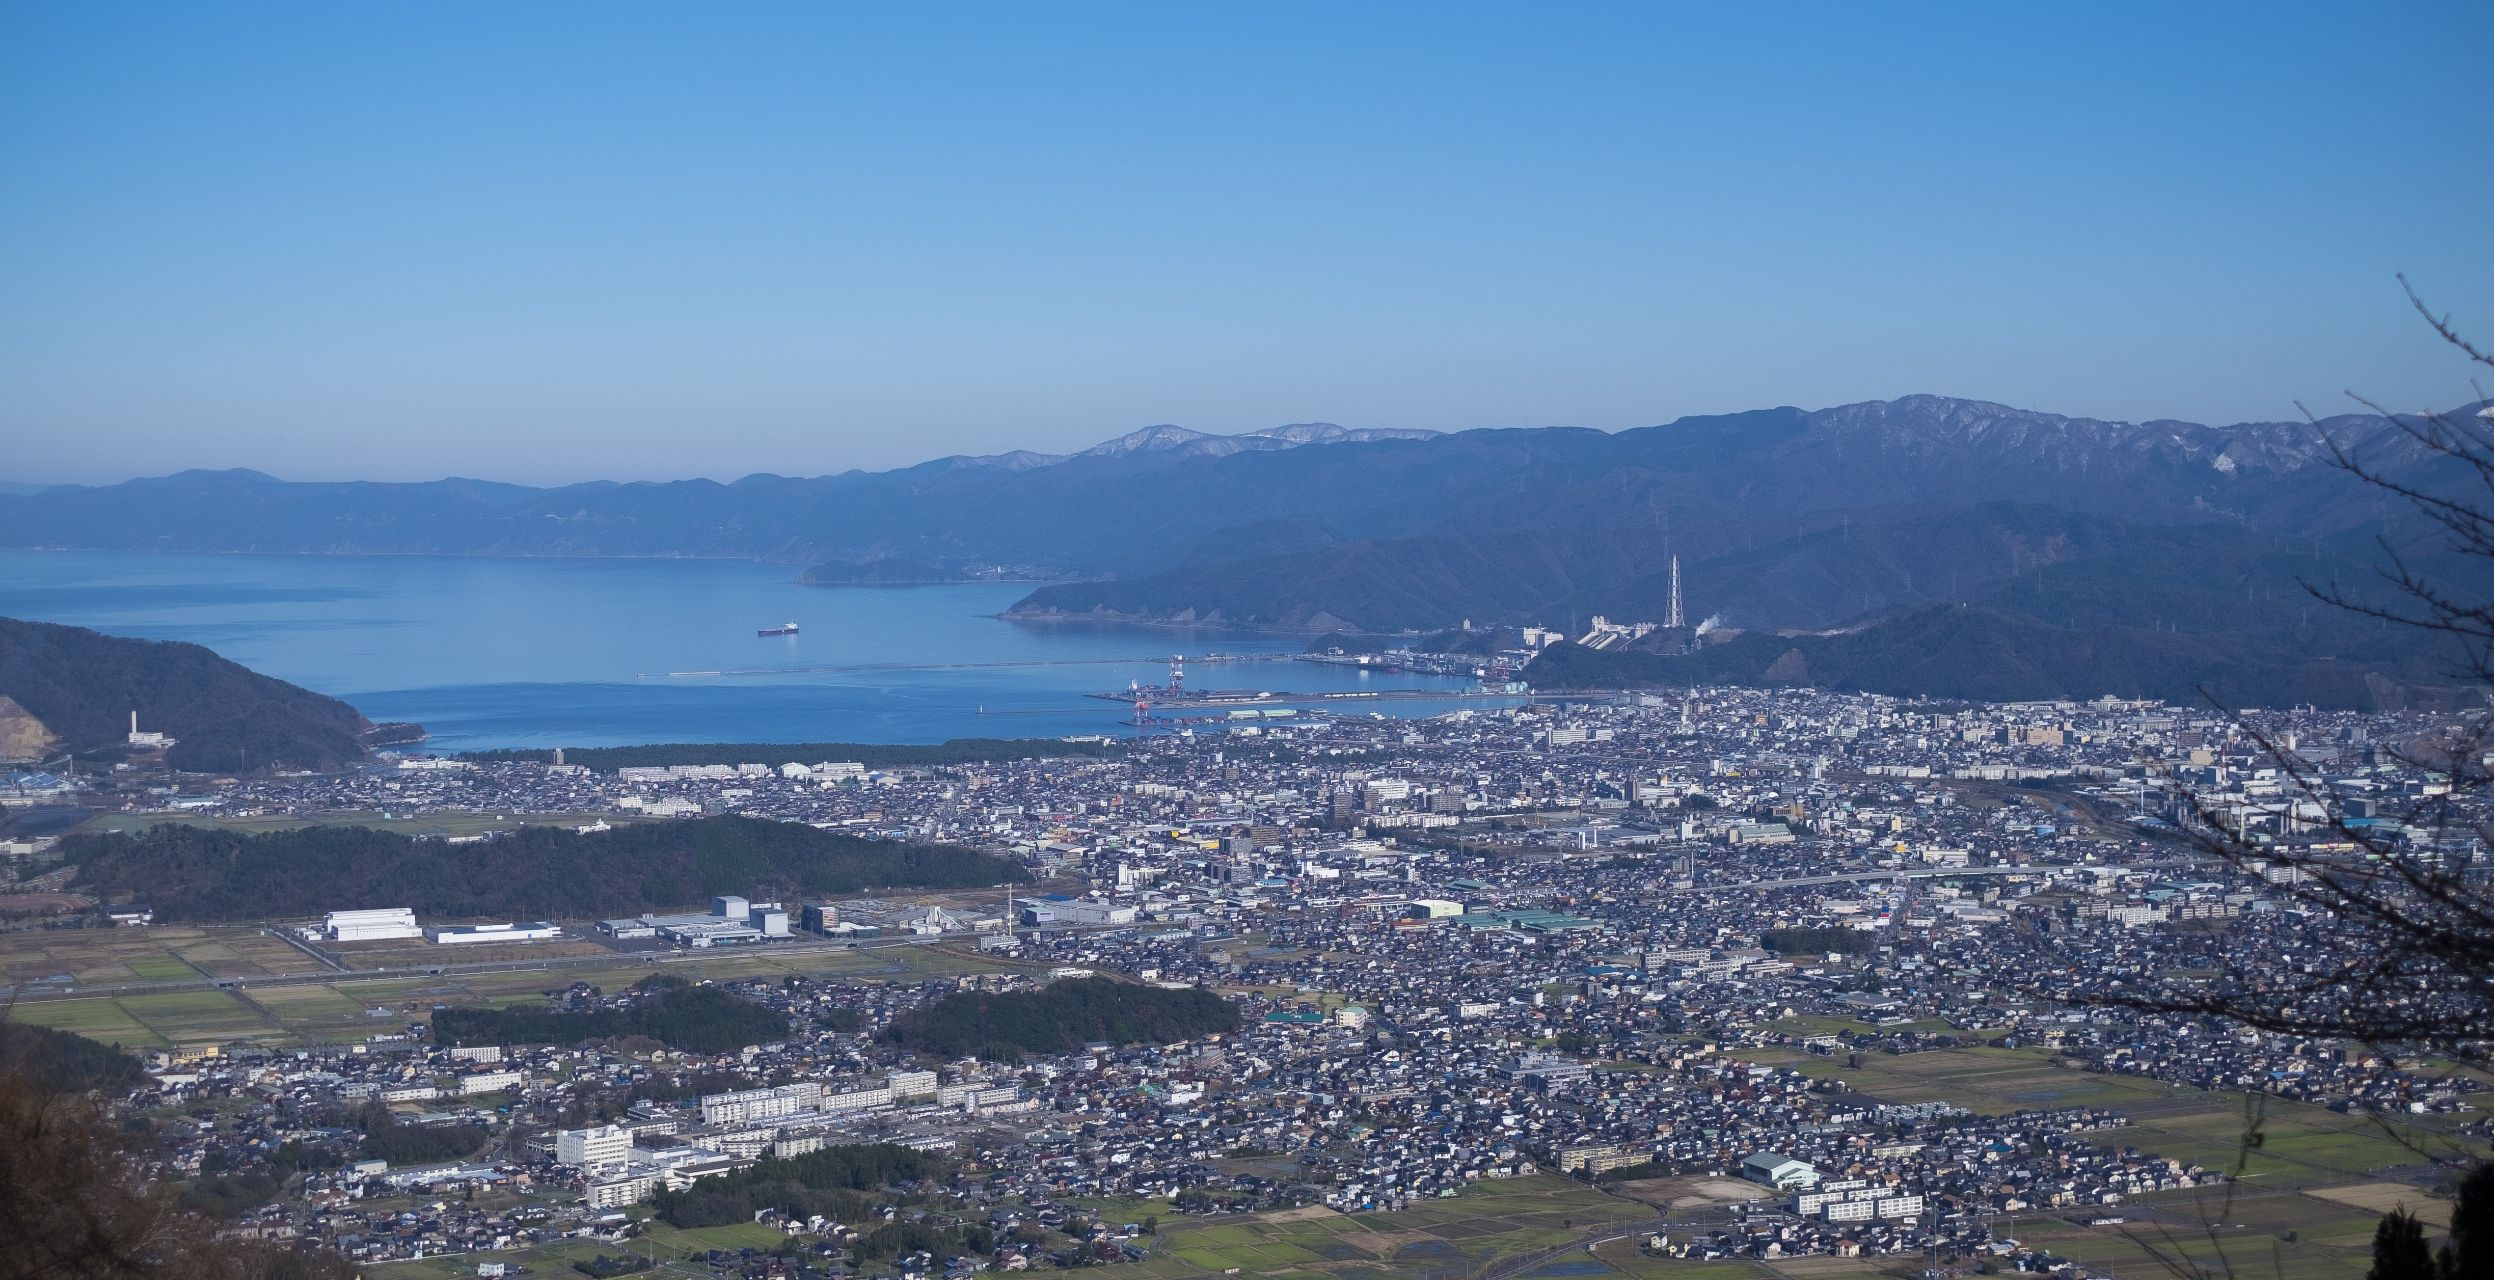
Attraction of Tsuruga City

Tsuruga, where the railway and the port town vine are the key points on the Sea of Japan side, is a port town that has flourished as a gateway to the continent since ancient times. In 1882, the railway opened between Tsuruga and Nagahama, and Tsuruga became the first town on the Japan Sea side where the railway ran.

Initiatives for Business Attraction

Attractive location and location of the city of Tsuruga Located in the center of Fukui Prefecture, about 14km east-west, about 26km north-south, with an area of 251.48 square kilometers (as of January 1, 2025), the Tsuruga Peninsula and 54k heavily out into Wakasa Bay

Contact Us: Business & Personal Inquiries

By proceeding, you agree to our Terms of Use And confirm you have read our Privacy Policy .

Notes

· We are available for inquiries 24 hours a day. Responses will be provided between 9:00 and 18:00 (including weekends, public holidays, and year-end/New Year holidays).
· Depending on the nature of your inquiry, it may take some time for us to respond.