Trends in Cargo Volume at Tsuruga Port
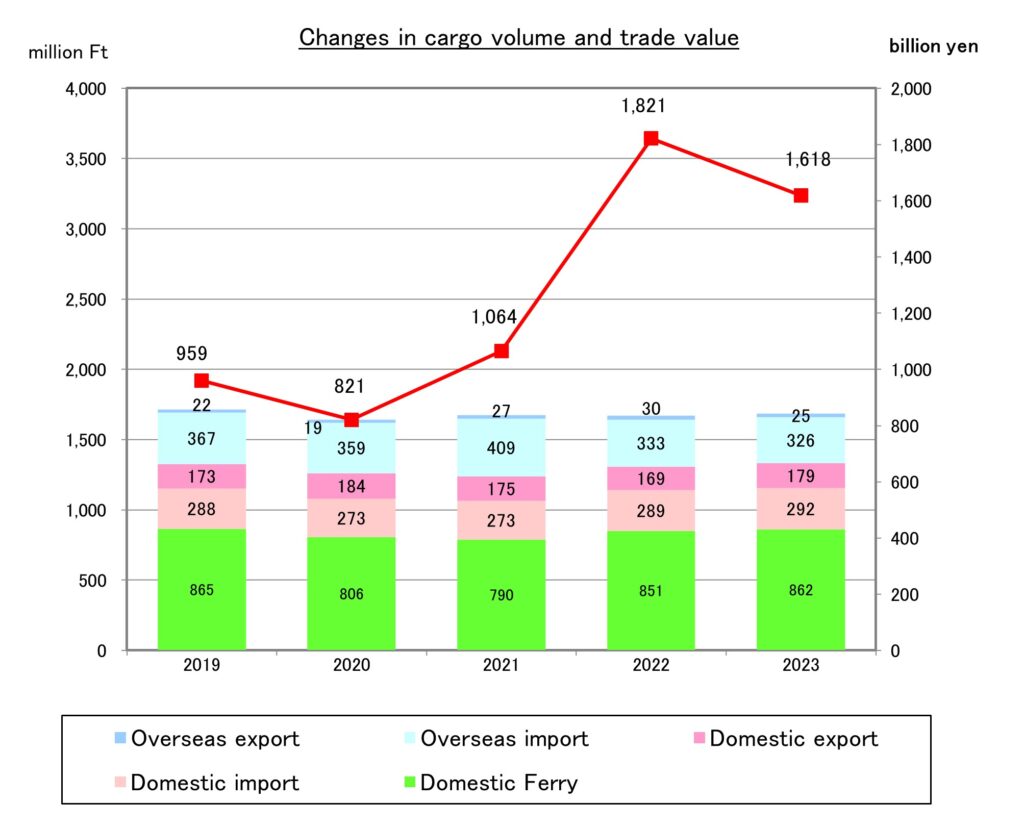
Cargo Volume Handled in 2023
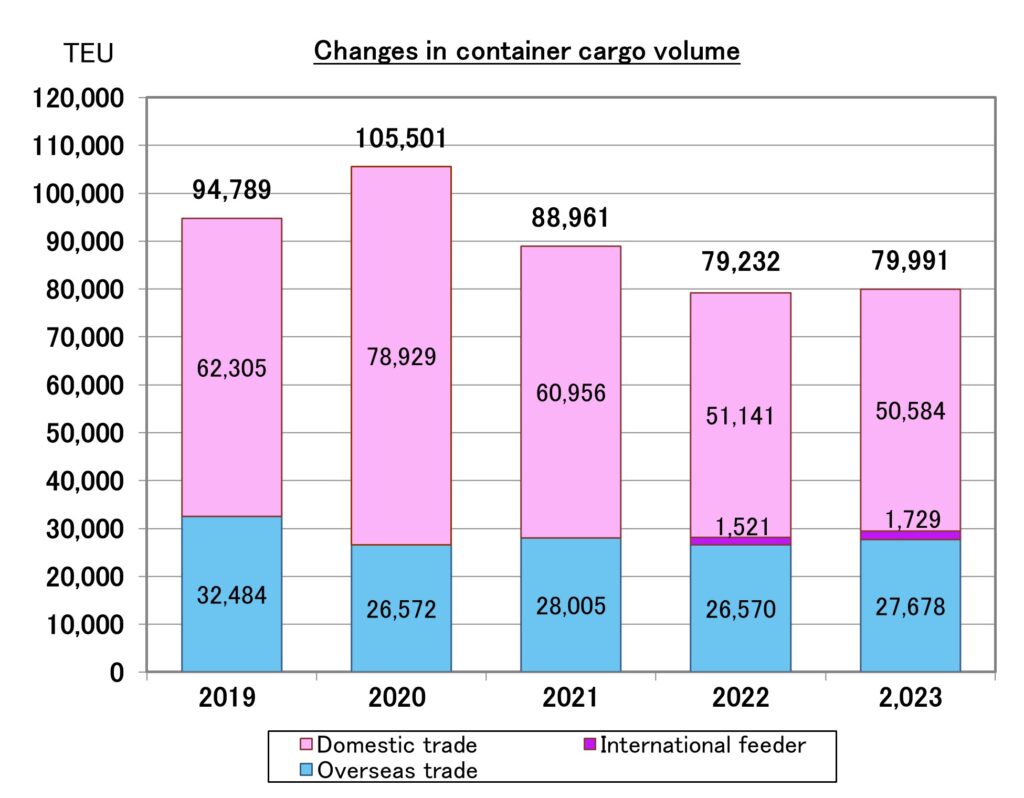
Container Cargo Volume Handled in 2023
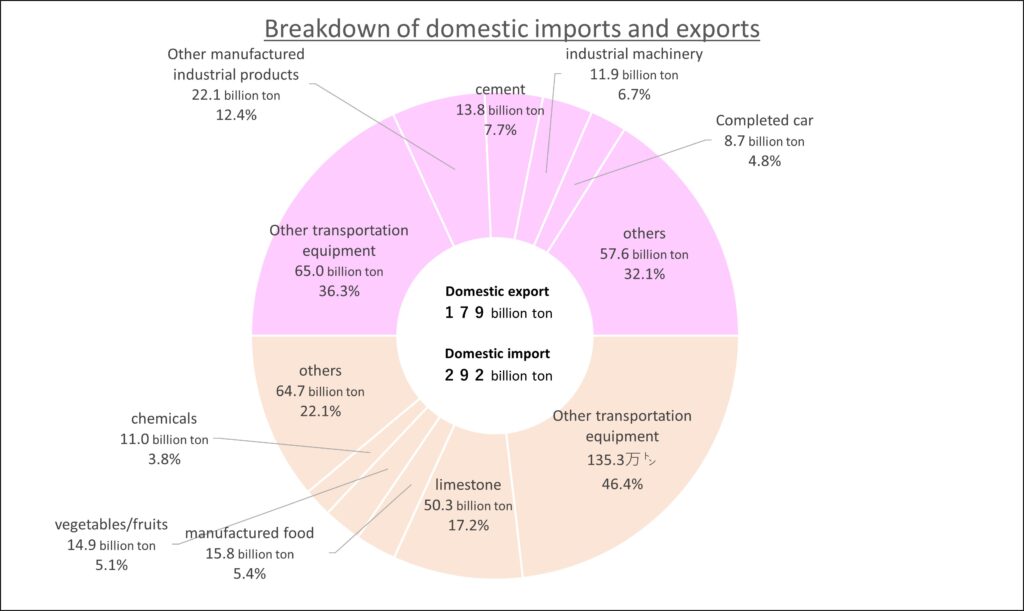
Breakdown of Handled Cargo Items (2023)
Foreign currency
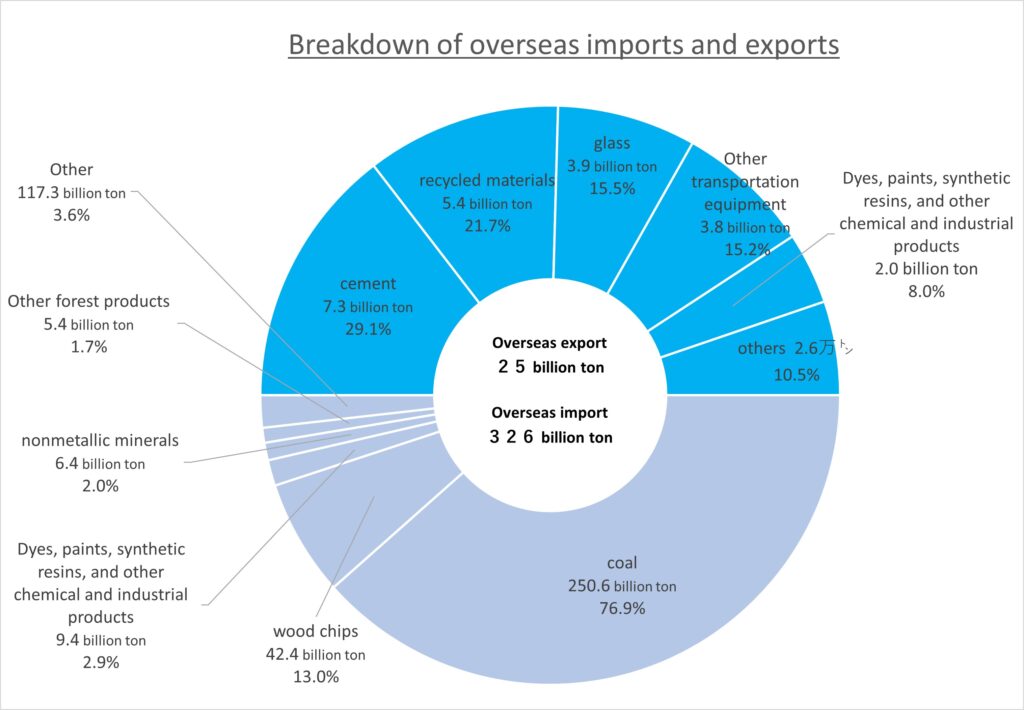
Domestic Currency
Cargo Volume by Year (Details)
2017 Tsuruga Port Statistical Yearbook
2018 Tsuruga Port Statistical Yearbook
2019 Tsuruga Port Statistical Yearbook
2020Tsuruga Port Statistical Yearbook
2021 Tsuruga Port Statistical Yearbook
2022 Tsuruga Port Statistical Yearbook
2023 Tsuruga Port Statistical Yearbook
Preliminary Container Handling Volume in 2023
○ NMonthly Container Handling Volume (TEU)
| Export | Import | Outgoing Transfer | Incoming Transfer | Total | |
| Jan. | 930 | 822 | 1,234 | 2,452 | 5,438 |
| Feb. | 999 | 858 | 1,459 | 2,586 | 5,902 |
| March | 978 | 1,103 | 1,716 | 2,577 | 6,374 |
| April | 1,138 | 1,022 | 1,645 | 2,368 | 6,173 |
| May | 853 | 1,074 | 1,106 | 1,750 | 4,783 |
| June | 1,196 | 1,133 | 1,332 | 2,055 | 5,716 |
| July | 1,224 | 1,383 | 1,471 | 2,778 | 6,856 |
| Aug. | 1,207 | 1,351 | 1,532 | 4,986 | 9,076 |
| Sept. | 1,132 | 1,380 | 1,672 | 4,540 | 8,724 |
| Oct. | 1,204 | 1,221 | 1,352 | 4,204 | 7,981 |
| Nov. | 1,532 | 1,481 | 1,224 | 2,586 | 6,823 |
| Dec. | 1,099 | 1,358 | 1,477 | 2,211 | 6,145 |
| Meters | 13,492 | 14,186 | 17,220 | 35,093 | 79,991 |
Maritime Cargo Throughput in 2023 (Preliminary Report)
○ Monthly Maritime Cargo Throughput (Unit: Tons)
| Export | Import | Outgoing Transfer | Incoming Transfer | Total | |
| Jan. | 21,188 | 414,754 | 460,958 | 468,981 | 1,365,881 |
| Feb. | 25,052 | 363,175 | 477,391 | 520,705 | 1,386,323 |
| March | 18,343 | 230,494 | 553,461 | 626,984 | 1,429,282 |
| April | 18,095 | 242,492 | 513,342 | 603,679 | 1,377,608 |
| May | 35,409 | 160,706 | 456,017 | 540,462 | 1,192,594 |
| June | 21,910 | 247,029 | 521,726 | 599,842 | 1,390,507 |
| July | 12,172 | 104,652 | 527,029 | 669,298 | 1,313,151 |
| Aug. | 23,449 | 400,153 | 556,196 | 646,641 | 1,626,439 |
| Sept. | 11,967 | 217,550 | 606,617 | 651,593 | 1,487,727 |
| Oct. | 20,776 | 335,446 | 577,901 | 663,566 | 1,597,689 |
| Nov. | 15,079 | 231,752 | 470,324 | 533,874 | 1,251,029 |
| Dec. | 25,658 | 311,444 | 485,476 | 596,255 | 1,418,833 |
| Meters | 249,098 | 3,259,647 | 6,206,438 | 7,121,880 | 16,837,063 |
Annual Transition Table of Container Cargo
2017-2023
○Total Container Volume Handled (TEU) *Numbers in parentheses indicate loaded containers
| Category/Year | Export | Import | Outgoing Transfer | Incoming Transfer | Total |
|---|---|---|---|---|---|
| 2017 | 19,975 | 19,590 | 9,986 | 28,281 | 77,832 |
| (10,680) | (17,671) | (5,394) | (28,073) | (61,818) | |
| 2018 | 18,275 | 18,315 | 10,201 | 29,980 | 76,771 |
| (10,175) | (17,536) | (5,769) | (29,808) | (63,288) | |
| 2019 | 16,494 | 15,990 | 22,259 | 40,046 | 94,789 |
| (8,030) | (15,287) | (8,238) | (31,441) | (62,996) | |
| 2020 | 13,285 | 13,287 | 26,010 | 52,919 | 105,501 |
| (6,627) | (12,932) | (8,841) | (34,149) | (62,549) | |
| 2021 | 13,992 | 14,013 | 17,150 | 43,806 | 88,961 |
| (6,932) | (13,265) | (9,454) | (33,974) | (63,625) | |
| 2022 | 13,173 | 13,397 | 17,576 | 35,086 | 79,232 |
| (6,459) | (12,079) | (11,640) | (35,048) | (65,226) | |
| 2023 | 13,492 | 14,186 | 17,220 | 35,093 | 79,991 |
| (7,047) | (13,219) | (11,923) | (35,043) | (67,232) |
(Reference) Container Cargo Volume by Port (FY2023 Preliminary Data – Extract: Sea of Japan Side of Honshu) (TEU)
| Port name | Total container handling volume | Foreign Trade Containers | Domestic Trade Containers |
|---|---|---|---|
| Akita Port | 46,615 | 30,340 | 16,275 |
| Niigata Port | 218,860 | 154,630 | 64,230 |
| Fushiki Toyama Port | 75,834 | 68,307 | 7,527 |
| Kanazawa Port | 67,251 | 67,251 | 0 |
| Tsuruga Port | 79,991 | 27,678 | 52,313 |
(From the 2023 MLIT Report: Container Cargo Volume by Port)
○ Loaded Foreign Trade Containers (Tonnage, TEU)
By division/year | Export | Import | Total | |||
|---|---|---|---|---|---|---|
| (Tons) | (TEU) | (Tons) | (TEU) | (Tons) | (TEU) | |
| 2017 | 153,593 | 10,680 | 236,006 | 17,671 | 389,599 | 28,351 |
| 2018 | 122,174 | 10,175 | 203,190 | 17,536 | 325,364 | 27,711 |
| 2019 | 100,992 | 8,030 | 213,172 | 15,287 | 314,164 | 23,317 |
| 2020 | 74,529 | 6,627 | 168,923 | 12,932 | 243,452 | 19,559 |
| 2021 | 71,842 | 6,932 | 144,662 | 13,265 | 216,504 | 20,197 |
| 2022 | 86,834 | 6,459 | 156,202 | 12,079 | 243,036 | 18,538 |
| 2023 | 83,252 | 7,047 | 169,473 | 13,219 | 252,725 | 20,266 |
Including on-chassis containers
Annual Transition Table of Maritime Cargo Throughput
2017-2023 (Unit: Tons)
By division/year | Foreign Trade | Internal Trade | Total | ||||
|---|---|---|---|---|---|---|---|
| Export | Import | Meters | Outgoing Transfer | Incoming Transfer | Meters | ||
| 2017 | 389,786 | 3,352,848 | 3,742,634 | 5,799,350 | 6,360,662 | 12,160,012 | 15,902,646 |
| 2018 | 296,158 | 3,493,542 | 3,789,700 | 5,875,909 | 6,295,536 | 12,171,445 | 15,961,145 |
| 2019 | 218,250 | 3,668,406 | 3,886,656 | 6,216,641 | 7,042,523 | 13,259,164 | 17,145,820 |
| 2020 | 190,691 | 3,589,747 | 3,780,438 | 5,962,585 | 6,656,455 | 12,619,040 | 16,399,478 |
| 2021 | 267,038 | 4,089,874 | 4,356,912 | 5,762,464 | 6,619,854 | 12,382,318 | 16,739,230 |
| 2022 | 296,989 | 3,325,336 | 3,622,325 | 6,056,063 | 7,035,613 | 13,091,676 | 16,714,001 |
| 2023 | 249,098 | 3,259,647 | 3,508,745 | 6,206,438 | 7,121,880 | 13,328,318 | 16,837,063 |
Annual Table of Incoming Vessels by Type
2017-2023
| By division/year | Commercial Vessel | Fishing Vessel | Other Vessels of the | Evacuation Vessel | Total | |||
|---|---|---|---|---|---|---|---|---|
| Ocean-going Vessels | Coastal Vessels | Meters | ||||||
| 2017 | (Number) | (363) | (1,025) | (1,388) | (116) | (575) | (1) | (2,081) |
| Total tonnage | 4,577,739 | 10,732,599 | 15,310,338 | 13,503 | 158,538 | 499 | 15,482,878 | |
| 2018 | (Number) | (355) | (1,011) | (1,366) | (154) | (488) | (2,008) | |
| Total tonnage | 4,301,498 | 10,869,775 | 15,171,273 | 20,312 | 96,259 | 15,287,844 | ||
| 2019 | (Number) | (340) | (1,196) | (1,536) | (99) | (361) | (1,966) | |
| Total tonnage | 4,204,000 | 12,251,702 | 16,455,702 | 11,206 | 86,229 | 16,553,137 | ||
| 2020 | (Number) | (296) | (1,258) | (1,554) | (94) | (359) | (2,007) | |
| Total tonnage | 3,600,873 | 13,181,050 | 16,781,923 | 11,156 | 116,991 | 16,910,070 | ||
| 2021 | (Number) | (290) | (1,189) | (1,479) | (70) | (410) | (1,959) | |
| Total tonnage | 3,834,678 | 12,454,921 | 16,289,599 | 8,840 | 142,910 | 16,441,349 | ||
| 2022 | (Number) | (264) | (1,252) | (1,516) | (63) | (414) | (1,993) | |
| Total tonnage | 3,209,041 | 12,707,815 | 15,916,856 | 8,343 | 201,285 | 16,126,484 | ||
| 2023 | (Number) | (255) | (1,149) | (1,404) | (59) | (389) | (1,852) | |
| Total tonnage | 3,340,424 | 12,010,970 | 15,351,394 | 7,954 | 170,254 | 15,529,602 | ||
Annual Transition Table of Ferry Usage
2017-2023
By division/year | Embarked and Disembarked Persons (persons) | Embarked and Disembarked Vehicles (units) | ||||
|---|---|---|---|---|---|---|
| Ride-on | Landing | Total | Outgoing Transfer | Incoming Transfer | Total | |
| 2017 | 38,427 | 45,123 | 83,550 | 65,221 | 58,062 | 123,283 |
| 2018 | 34,516 | 40,845 | 75,361 | 67,685 | 58,449 | 126,134 |
| 2019 | 39,900 | 44,489 | 84,389 | 67,384 | 60,080 | 127,464 |
| 2020 | 19,607 | 22,391 | 41,998 | 55,717 | 52,573 | 108,290 |
| 2021 | 20,154 | 22,189 | 42,343 | 54,383 | 51,767 | 106,150 |
| 2022 | 30,114 | 32,548 | 62,662 | 61,899 | 58,087 | 119,986 |
| 2023 | 39,773 | 42,968 | 82,741 | 65,336 | 59,694 | 125,030 |
Related file download
- 2017 Tsuruga Port Statistical Yearbook (PDF format, 2,367 KB)
- 2018 Tsuruga Port Statistical Yearbook (PDF format, 2,367 KB)
- 2019 Tsuruga Port Statistical Yearbook (PDF format, 2,367 KB)
- 2020 Tsuruga Port Statistical Yearbook (PDF format, 2,367 KB)
- 2021 Tsuruga Port Statistical Yearbook (PDF format, 2,367 KB)
- 2022 Tsuruga Port Statistical Yearbook (PDF format, 2,367 KB)
- 2023 Tsuruga Port Statistical Yearbook (PDF format, 2,367 KB)